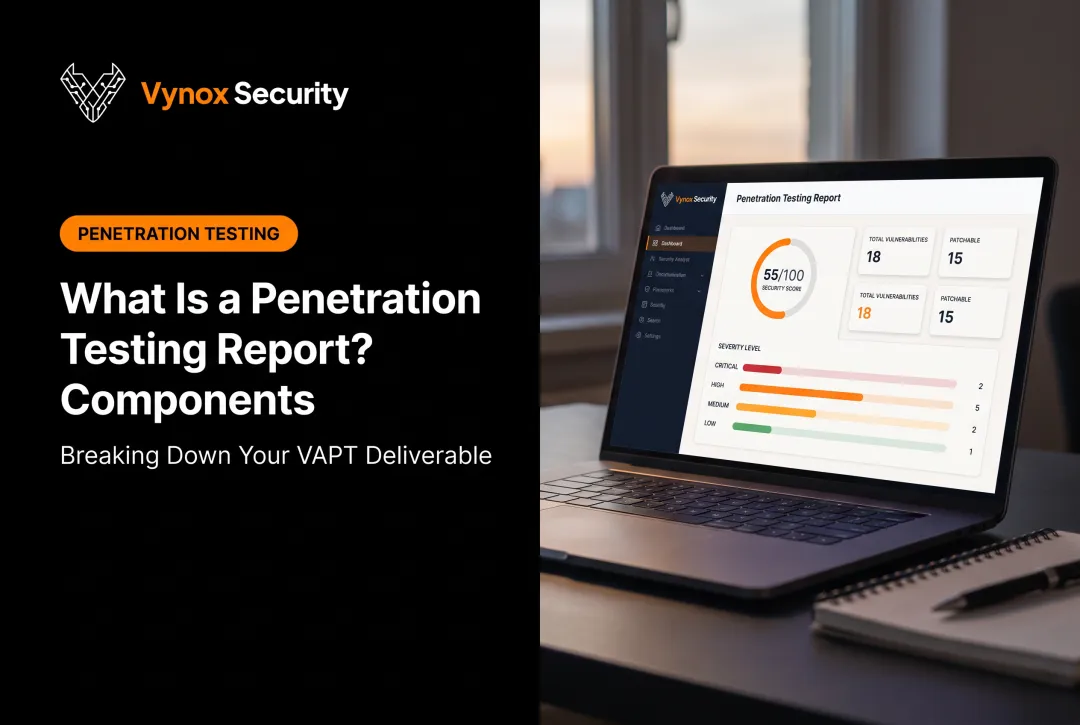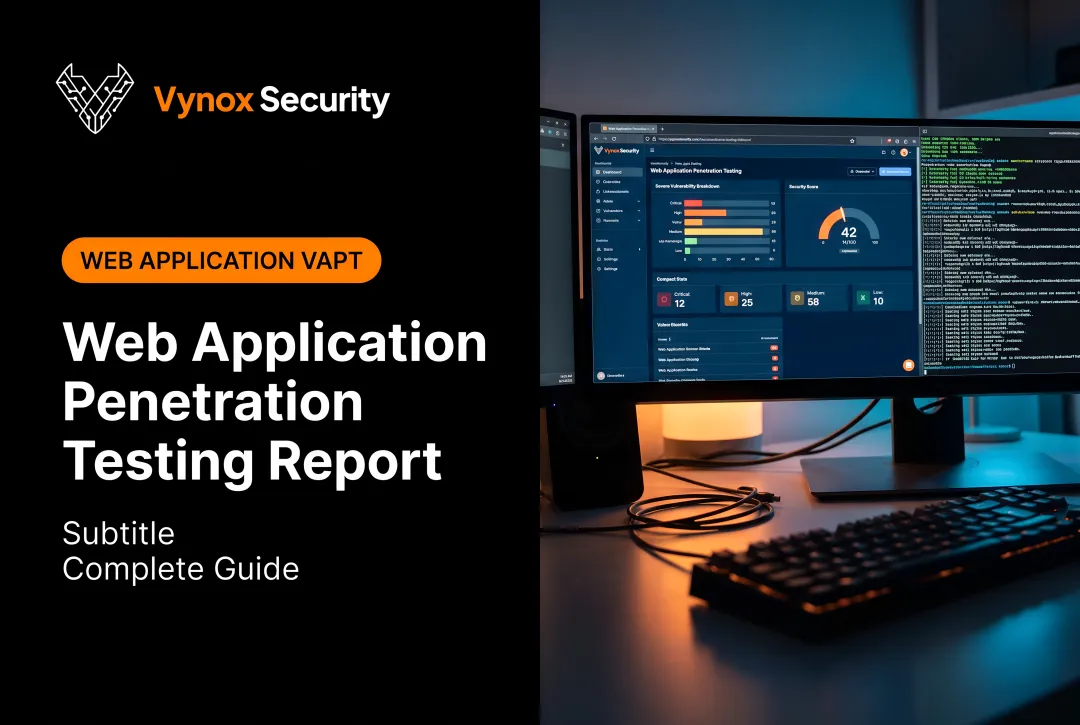
That's a problem. Many organizations treat the report as proof that testing happened, not as a working document meant to drive action. Developers never see the technical findings. Executives never track whether fixes actually shipped. The engagement becomes a compliance checkbox instead of a security improvement plan.
This guide breaks down every section of a modern pentest report, explains how executives, developers, and auditors should each use it differently, and covers a shift many traditional reports still miss: AI systems introduce findings — prompt injection, RAG data leakage, agent misuse — that legacy report templates were never built to capture.
Key Takeaways
- A pentest report documents scope, methodology, evidence, and remediation guidance, not a bare vulnerability list with severity tags
- OWASP- and NIST-based reports map more easily to SOC 2, ISO 27001, and PCI DSS audits
- Real value starts after delivery: assign ownership, set retest timelines, and track Mean Time to Remediate (MTTR)
- Traditional reports miss AI-specific risks like prompt injection and RAG leakage, which need purpose-built testing methods
What Is a Penetration Testing Report?
A penetration testing report is the final deliverable from a simulated attack engagement. It documents what was tested, how it was tested, what was found, and what to do about it.
Different readers use the same report differently:
- Executives want business risk and next steps
- Developers want reproduction steps and fixes
- Auditors want evidence that maps to specific controls
A well-built report serves all three without forcing anyone to dig through content meant for someone else.
Most credible firms structure findings around recognized frameworks like OWASP and NIST, keeping reports consistent and audit-ready. Vynox Security, for example, maps every finding to OWASP Top 10, OWASP API Top 10, or OWASP LLM Top 10 depending on the engagement. That mapping translates directly into evidence for SOC 2 and ISO 27001 audits.
Here's the distinction that matters most: a vulnerability scan is automated and unvalidated. A penetration test report contains human-verified findings with proof of exploitability.
NIST's SP 800-115 guidance draws this line explicitly. Scanning matches systems against known signatures and produces high false-positive rates that require human interpretation. A true penetration test, by contrast, mimics real-world attacks and verifies weaknesses through actual exploitation.
The 7 Phases Behind Every Report
Every credible pentest follows a consistent sequence, and each phase leaves a fingerprint in the final document:
- Pre-engagement and scoping: defines targets, rules, and objectives
- Reconnaissance: gathers intelligence on the target environment
- Threat modeling: identifies likely attack paths based on business context
- Vulnerability analysis: surfaces potential weaknesses
- Exploitation: proves weaknesses are real by exploiting them
- Post-exploitation: assesses how far an attacker could go
- Reporting: documents everything above into a usable deliverable
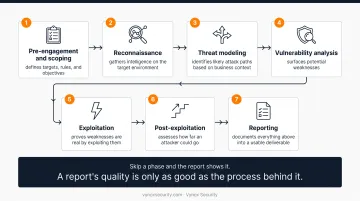
Skip a phase and the report shows it. Skipping threat modeling, for instance, tends to produce reports that list findings with no business context: a pile of vulnerabilities with no sense of which ones actually threaten the organization. A report's quality is only as good as the process behind it.
Essential Sections Every Pentest Report Should Include
Regardless of vendor, a credible report should follow a consistent structural checklist. If any of the following sections is missing or thin, that's a red flag.
Executive Summary
This section should be written in plain language for the C-suite: scope, business risk, and what needs to happen next. It should never be a technical vulnerability table dressed up in bullet points.
A strong executive summary also includes validated positive findings (controls and defenses that held up under testing), not just weaknesses. That balance gives leadership an honest, complete picture of security posture rather than a list of everything that went wrong.
Scope, Methodology & Rules of Engagement
This section documents:
- In-scope and out-of-scope assets
- Testing windows and any blackout periods
- Tools and techniques used
- Client-provided credentials or access allowances
Clearly stated exclusions protect both parties legally and clarify what was not tested — which matters just as much as what was.
Findings & Evidence
Each finding should include a title, severity rating, description, affected systems, proof-of-concept evidence, and reproduction steps. Findings should map to recognized classification systems like OWASP so auditors and engineers speak the same language.
Great reports also include an attack narrative that shows how individual issues chain together into a real compromise path, rather than presenting isolated bugs with no connective tissue.
Risk Ratings & Prioritization
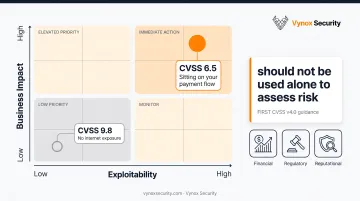
CVSS scoring gives a standardized starting point, but severity and risk aren't the same thing. FIRST's CVSS v4.0 guidance is explicit on this: the base score measures severity and "should not be used alone to assess risk." Business consequences, including financial, regulatory, and reputational impact, sit outside CVSS entirely.
That's why a triage grid matters more than a raw score. Rank findings by exploitability and business impact, not just the number CVSS spits out. A 9.8 on a system with no internet exposure may matter less than a 6.5 sitting on your payment flow.
Remediation, Retesting & Appendices
A report should assign clear next steps, retest timelines, and tracking status — whether a finding is verified fixed, still open, or formally risk-accepted. Appendices (tool outputs, change logs, attestation letters) support audit evidence requirements down the line.
Retest speed matters here too. Vynox's PTaaS model verifies fixes the same day engineers push them to staging, a pace that stands in sharp contrast to the multi-week retest cycles common at traditional firms.
What Separates a Good Report From a Great One
Most reports check the boxes above. Few actually change how fast a team fixes things. The gap usually comes down to four factors.
- Calibrated risk scoring. Severity tied to real business impact, not guesswork or inflated numbers, is what builds trust with security teams and auditors alike.
- Full attack narrative. Top-tier reports show the exact path from initial access to compromise, not just a "destination" finding dropped with no context.
- Tester transparency. Reports should disclose who performed the testing and how deep the methodology went, signaling genuine manual expertise versus a templated scan with a logo slapped on top.
- Developer-ready remediation. Generic advice like "sanitize your inputs" doesn't move fast. Stack-specific fix guidance with reproduction steps does.
For AI-powered products, a great report has to go further still. Traditional web and network findings aren't enough when your attack surface includes a language model, a retrieval pipeline, or an autonomous agent.
Prompt injection, jailbreaks, RAG data leakage, and agent misuse all need dedicated testing against the OWASP LLM Top 10, not bolted on as an afterthought.
This is where Vynox Security builds every AI engagement differently. Testing runs against 40+ prompt injection and jailbreak techniques, from direct injection and role-play exploits to multi-turn attack chains designed to gradually erode guardrails.
Findings map directly to OWASP LLM categories, then roll into audit-ready evidence packs:
- Prompt injection maps to LLM-01
- RAG exposure maps to LLM-06
- Agent hijacking maps to LLM-08
- Model inversion maps to LLM-10
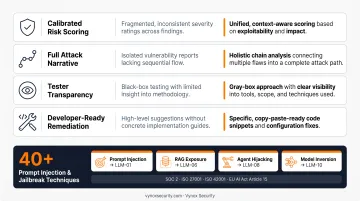
The same engagement produces both security proof and compliance documentation for SOC 2, ISO 27001, ISO 42001, and EU AI Act Article 15.
How to Read and Use a Pentest Report by Role
The same report gets read three different ways, and treating it as one-size-fits-all is where most organizations lose value.
Executives should focus on business impact, ownership assignment, and risk posture trends over time, not individual CVE numbers. Instead of asking what a SQL injection is, ask who owns fixing it and whether the overall risk trend is improving or getting worse.
Developers and engineers should work findings by severity and blast radius, validate fixes against reproduction steps, and request retesting rather than treating the report as a one-time checklist to close and forget.
Whoever owns the program should also track KPIs across cycles, not just within a single engagement:
- Mean Time to Remediate (MTTR) by severity
- Percentage of critical issues closed within target windows
- Vulnerability recurrence rate across testing cycles
Context matters here. Edgescan's 2026 Vulnerability Statistics Report puts average MTTR at 54.81 days for high/critical application and API findings, and 39 days for high/critical device and network findings. If your team's numbers sit well above that, the process around the report needs fixing, not the report itself.
Pentest Reports vs. SAST and DAST Reports
SAST (Static Application Security Testing) scans source code before deployment. DAST (Dynamic Application Security Testing) probes a running application automatically. Both are scanner-driven and produce findings without a human validating whether they're actually exploitable.
A penetration testing report is different by design:
| Aspect | SAST/DAST | Pentest Report |
|---|---|---|
| Method | Automated scanning | Manual, human-driven exploitation |
| Validation | Unvalidated, high false-positive rate | Proof-of-exploitability included |
| Context | Pattern-matched code/traffic issues | Business-context risk scoring |
| Output | Flagged findings list | Narrative evidence and remediation path |
Mature security programs don't pick one over the other. They run SAST and DAST continuously as first-line coverage, layering periodic, deeper penetration tests on top.
Vynox's continuous PTaaS model reflects this cadence directly, aligning testing to development sprints so manual validation happens alongside automated scanning rather than months after it.
Frequently Asked Questions
What is a standard penetration testing report?
A standard report includes an executive summary, scope and methodology, findings with evidence and severity ratings, and remediation recommendations. Most follow a recognized structure like PTES or NIST for consistency.
What are the 7 phases of penetration testing?
Pre-engagement, reconnaissance, threat modeling, vulnerability analysis, exploitation, post-exploitation, and reporting. Each phase feeds directly into the quality of the final deliverable.
What are penetration testing reports?
They're the formal documented outcome of a simulated attack. Technical teams use them to drive remediation, while leadership uses them to demonstrate security posture and compliance.
What are SAST and DAST reports?
SAST reports come from static code analysis before deployment; DAST reports come from testing a running application dynamically. Both differ from human-led pentest reports, which validate exploitability manually.
What's the difference between a pentest report and a vulnerability scan report?
A scan report lists unvalidated, automated findings with a high false-positive rate. A pentest report includes manually verified, exploited, and risk-contextualized findings with proof.
How often should a business request a new penetration testing report?
PCI DSS mandates testing every 12 months plus retesting after major changes. SOC 2 and ISO 27001 don't set a fixed interval, but AI systems with frequent updates benefit from continuous, release-aligned testing (PTaaS) over an annual cycle.